
Total Cost of Ownership: Custom Software vs. SaaS Subscriptions Over 5 Years
Last updated: July 17, 2026 · By Joseph Olivas, Founder, MEAN Consultors · 9 min read
Almost every software decision I help U.S. business owners make eventually comes down to one uncomfortable question: is it cheaper to buy a subscription or to build our own? The monthly SaaS price always wins the first look — it’s small, predictable, and requires no upfront investment. But “total cost of ownership” is a five-year question, not a one-month question. This article walks through a transparent TCO model so you can see exactly where the money goes and decide with numbers instead of gut feel.
What “total cost of ownership” actually includes
Total cost of ownership is the sum of every dollar a tool costs you across its useful life — not just the sticker price. For SaaS, that means subscription fees, per-seat charges, annual price increases, premium tiers you get pushed into, and the integration work needed to make it talk to your other systems. For custom software development, TCO means the upfront build, hosting, and ongoing maintenance — but no per-seat tax and no renewal that resets higher every January.
The mistake I see most often is comparing a SaaS monthly price to a custom build’s one-time price. Those aren’t the same unit. To compare fairly, you have to put both on the same five-year timeline and add every recurring line item.
A five-year TCO model: custom build vs. SaaS
Below is an illustrative model for a mid-size business running a core operational tool across a 25-person team. The custom option assumes a ~$75,000 build plus roughly $10–12k per year in maintenance and hosting. The SaaS option assumes about $100 per seat per month rising ~10% annually — well within the 8–20% range vendors have pushed through recently. These are modeling assumptions, not a quote; your numbers will differ, but the shape of the curve rarely does.
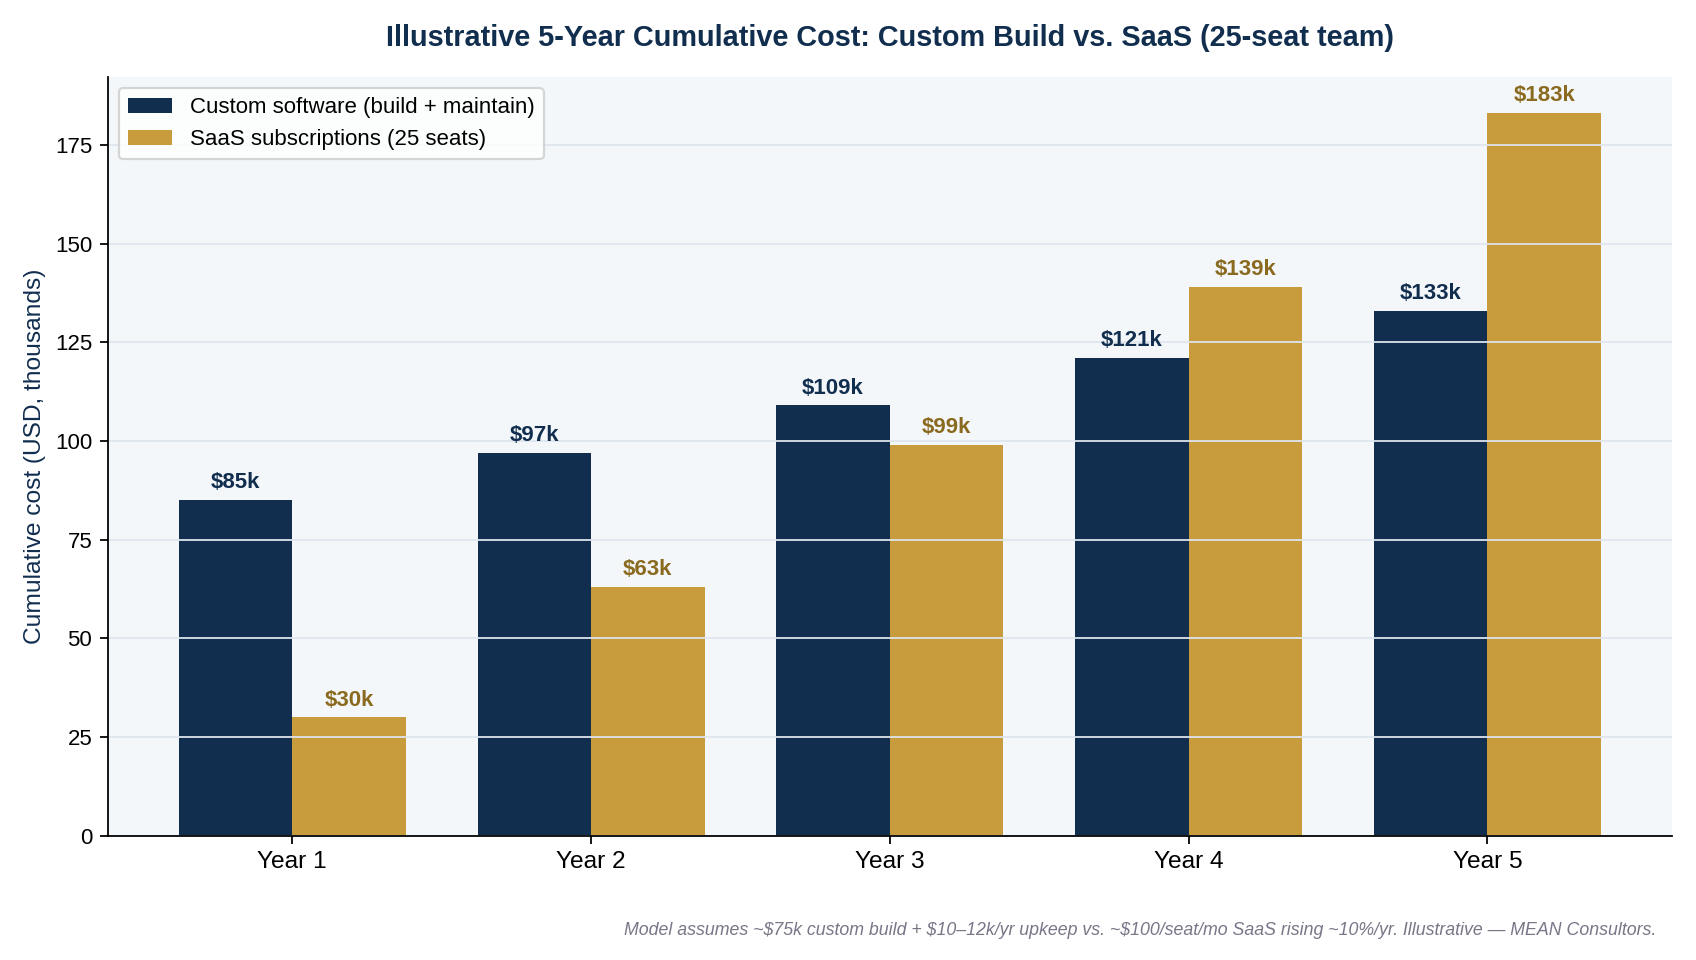
Figure 1: Illustrative cumulative cost by year. SaaS starts far cheaper, then overtakes the custom build as recurring fees compound.
| End of year | Custom software (cumulative) | SaaS — 25 seats (cumulative) | Difference |
|---|---|---|---|
| Year 1 | $85,000 | $30,000 | SaaS cheaper by $55k |
| Year 2 | $97,000 | $63,000 | SaaS cheaper by $34k |
| Year 3 | $109,000 | $99,000 | SaaS cheaper by $10k |
| Year 4 | $121,000 | $139,000 | Custom cheaper by $18k |
| Year 5 | $133,000 | $183,000 | Custom cheaper by $50k |
- In this model the break-even point lands early in Year 4 — after that, custom is cheaper every year.
- By Year 5 the SaaS total is roughly 38% higher than the custom build, entirely because of recurring and escalating fees.
- The more seats you add and the longer you keep the tool, the faster SaaS crosses over — and the wider the five-year gap becomes.
Why SaaS costs climb every single year
SaaS pricing is designed to grow with you, and that’s the part owners underestimate. Gartner projects worldwide software spending will rise about 14.7% in 2026, and analysts note a meaningful share of that growth is simply vendors raising prices on tools companies already have — with CIOs setting aside roughly 9% of IT budgets just to absorb increases. SaaS management data shows individual vendors pushing renewals up 8–12% on average, and some large platforms 10–20%, year over year.
Three compounding forces drive the climb: per-seat pricing (every hire raises the bill), annual renewal increases, and feature gating that nudges you into higher tiers to unlock capabilities you eventually need. None of these are visible in the first month’s invoice, which is exactly why the day-one comparison is so misleading.
Where the money actually goes over five years
The two options don’t just differ in total — they differ in shape. Custom software front-loads cost into the build, then flattens. SaaS spreads cost thin at first, then lets it compound. Seeing the composition side by side makes the trade-off concrete.
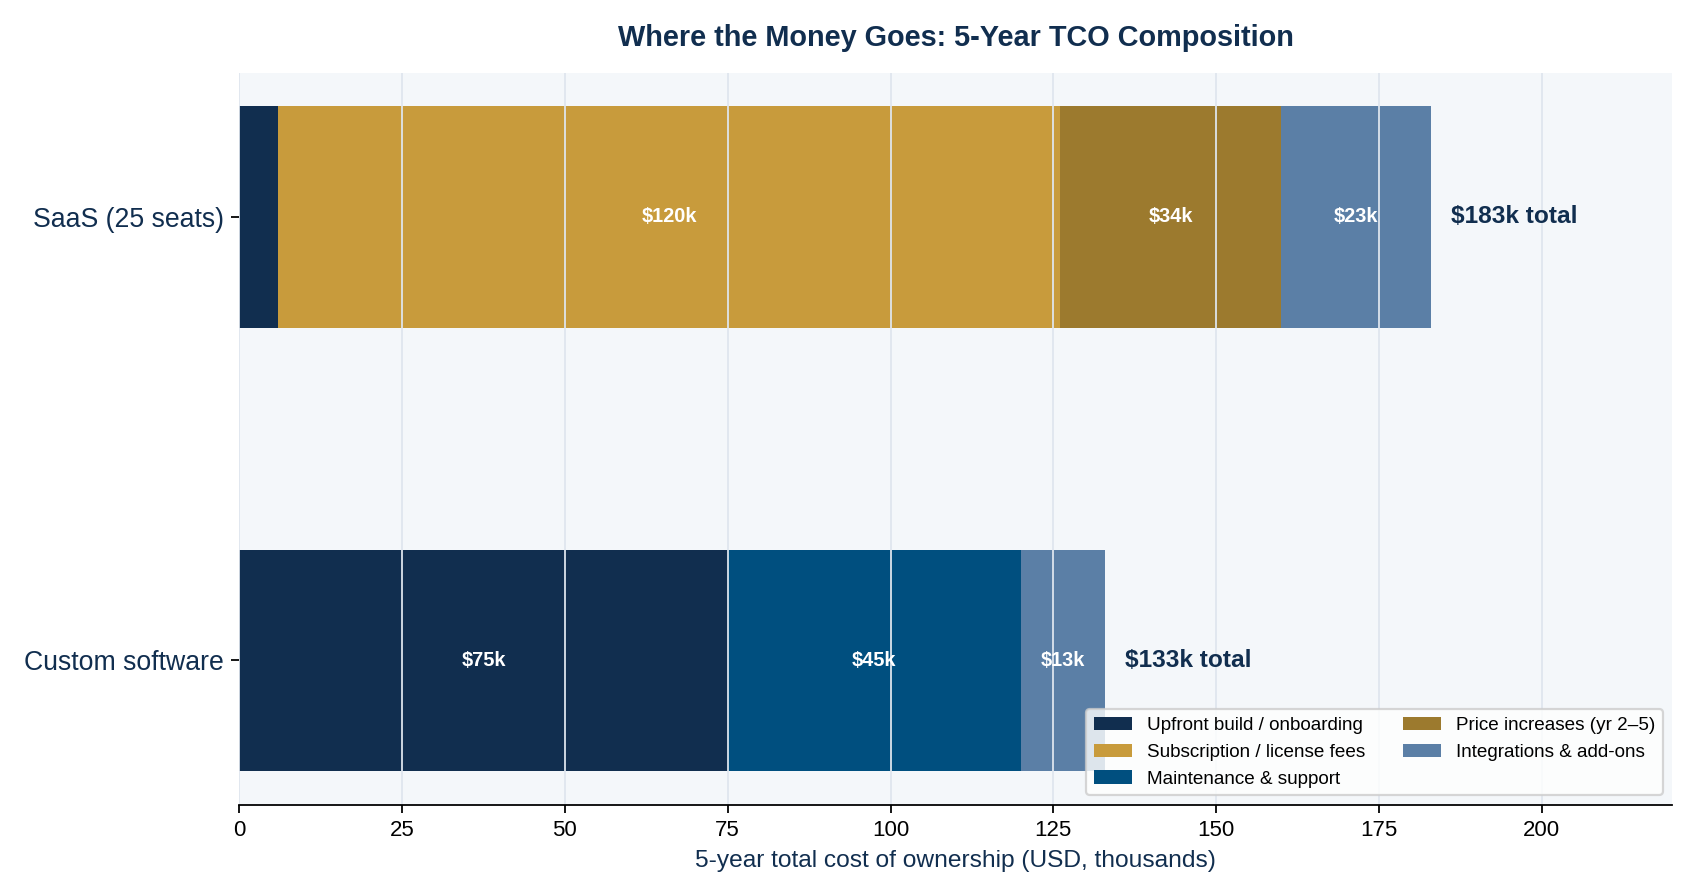
Figure 2: Five-year TCO composition. Custom cost is dominated by the upfront build; SaaS cost is dominated by recurring subscription fees plus price increases.
With custom software you own the asset. There’s no per-seat penalty for growth, no renewal negotiation, and you control the roadmap — features get built when your business needs them, not when a vendor decides to ship them. The trade-off is real upfront investment and responsibility for maintenance. That’s a good deal when the tool is central to your operation and you’ll use it for years; it’s a poor deal for something peripheral or short-lived. If you’re weighing this broadly, our guide on custom software vs. off-the-shelf covers the decision beyond just cost.
When SaaS is still the smart buy
TCO math doesn’t always favor building. SaaS frequently wins, and I recommend it often. Choose subscriptions when the following are true:
- Your team is small and unlikely to scale seats quickly — per-seat pricing stays cheap.
- An off-the-shelf product already fits 90%+ of your workflow with no heavy customization.
- The function is commodity, not competitive advantage (email, accounting, video calls).
- You need it live this week, not in three months.
- Requirements are still shifting and you don’t yet know what “right” looks like.
The inverse is when to build: large or growing teams, a workflow no product fits cleanly, a process that is your competitive edge, and a multi-year horizon. Many businesses land in the middle — SaaS for commodity functions, custom for the one or two workflows that define them.
How to run your own TCO comparison
You can build this comparison in a spreadsheet in an afternoon. Work through these steps honestly:
- Set a realistic horizon — five years is standard for core tools.
- For SaaS, list current per-seat cost, projected seat count each year, and a 10% annual increase.
- Add SaaS integration, migration, and premium-tier costs — they’re easy to forget.
- For custom, estimate the build, then add annual hosting and maintenance (budget ~15% of build cost per year).
- Chart cumulative cost for both and find the crossover year.
- Weigh non-cost factors: ownership, control, speed to launch, and fit.
If you’d rather pressure-test the numbers with someone who builds both, that’s exactly the kind of scoping conversation we have with clients before a single line of code is written.
Frequently Asked Questions
Is custom software always cheaper than SaaS over five years?
No. Custom tends to win on TCO when the team is large or growing, the tool is core to operations, and you’ll use it for years. For small teams, commodity functions, or short-lived needs, SaaS is usually cheaper and smarter. The crossover in our 25-seat model lands in Year 4 — a smaller team pushes that point later, sometimes past the point where it matters.
What is total cost of ownership for software?
TCO is every cost a tool incurs across its useful life: for SaaS, subscription and per-seat fees, annual price increases, premium tiers, and integration work; for custom software, the upfront build plus ongoing hosting and maintenance. Comparing a SaaS monthly price to a custom one-time price is the classic mistake — you have to put both on the same multi-year timeline.
How much do SaaS prices increase each year?
Independent SaaS management data shows average renewal increases of roughly 8–12% per year, with some large platforms raising prices 10–20%. Gartner projects overall software spending up about 14.7% in 2026, and notes a large share of that is vendors charging more for tools companies already own. Always model renewal increases, not just today’s price.
What is the break-even point between building and subscribing?
It’s the year when the custom build’s cumulative cost drops below the SaaS cumulative cost. In our illustrative model that’s early Year 4. It arrives sooner with more seats and higher SaaS price increases, and later with a small, stable team on a cheap subscription.
Do I have to maintain custom software myself?
Not necessarily. Most businesses contract ongoing maintenance and hosting — typically budgeted around 15% of the build cost per year — which is already included in the custom TCO figures above. You own the software either way; you just decide who keeps it running.
Can I mix SaaS and custom software?
Yes, and most businesses should. The common pattern is SaaS for commodity functions like email and accounting, and custom software for the one or two workflows that are your competitive advantage. TCO analysis helps you decide which bucket each tool belongs in.
MEAN Consultors builds custom software for U.S. businesses and will run an honest TCO comparison with you before recommending anything.